MTEB, the Massive Text Embedding Benchmark [1], is the standard way to compare text embedding models — the models that turn a piece of text into a list of numbers, so that search and RAG systems can find related text. It collects many datasets into one score per model, and its public leaderboard on Hugging Face is where most teams go to pick a model.
That leaderboard also has a per-language view, which is what this post is about. If you build search for Malayalam or Hindi, that column is probably the only evidence you have ever seen about how a model will behave in your language.
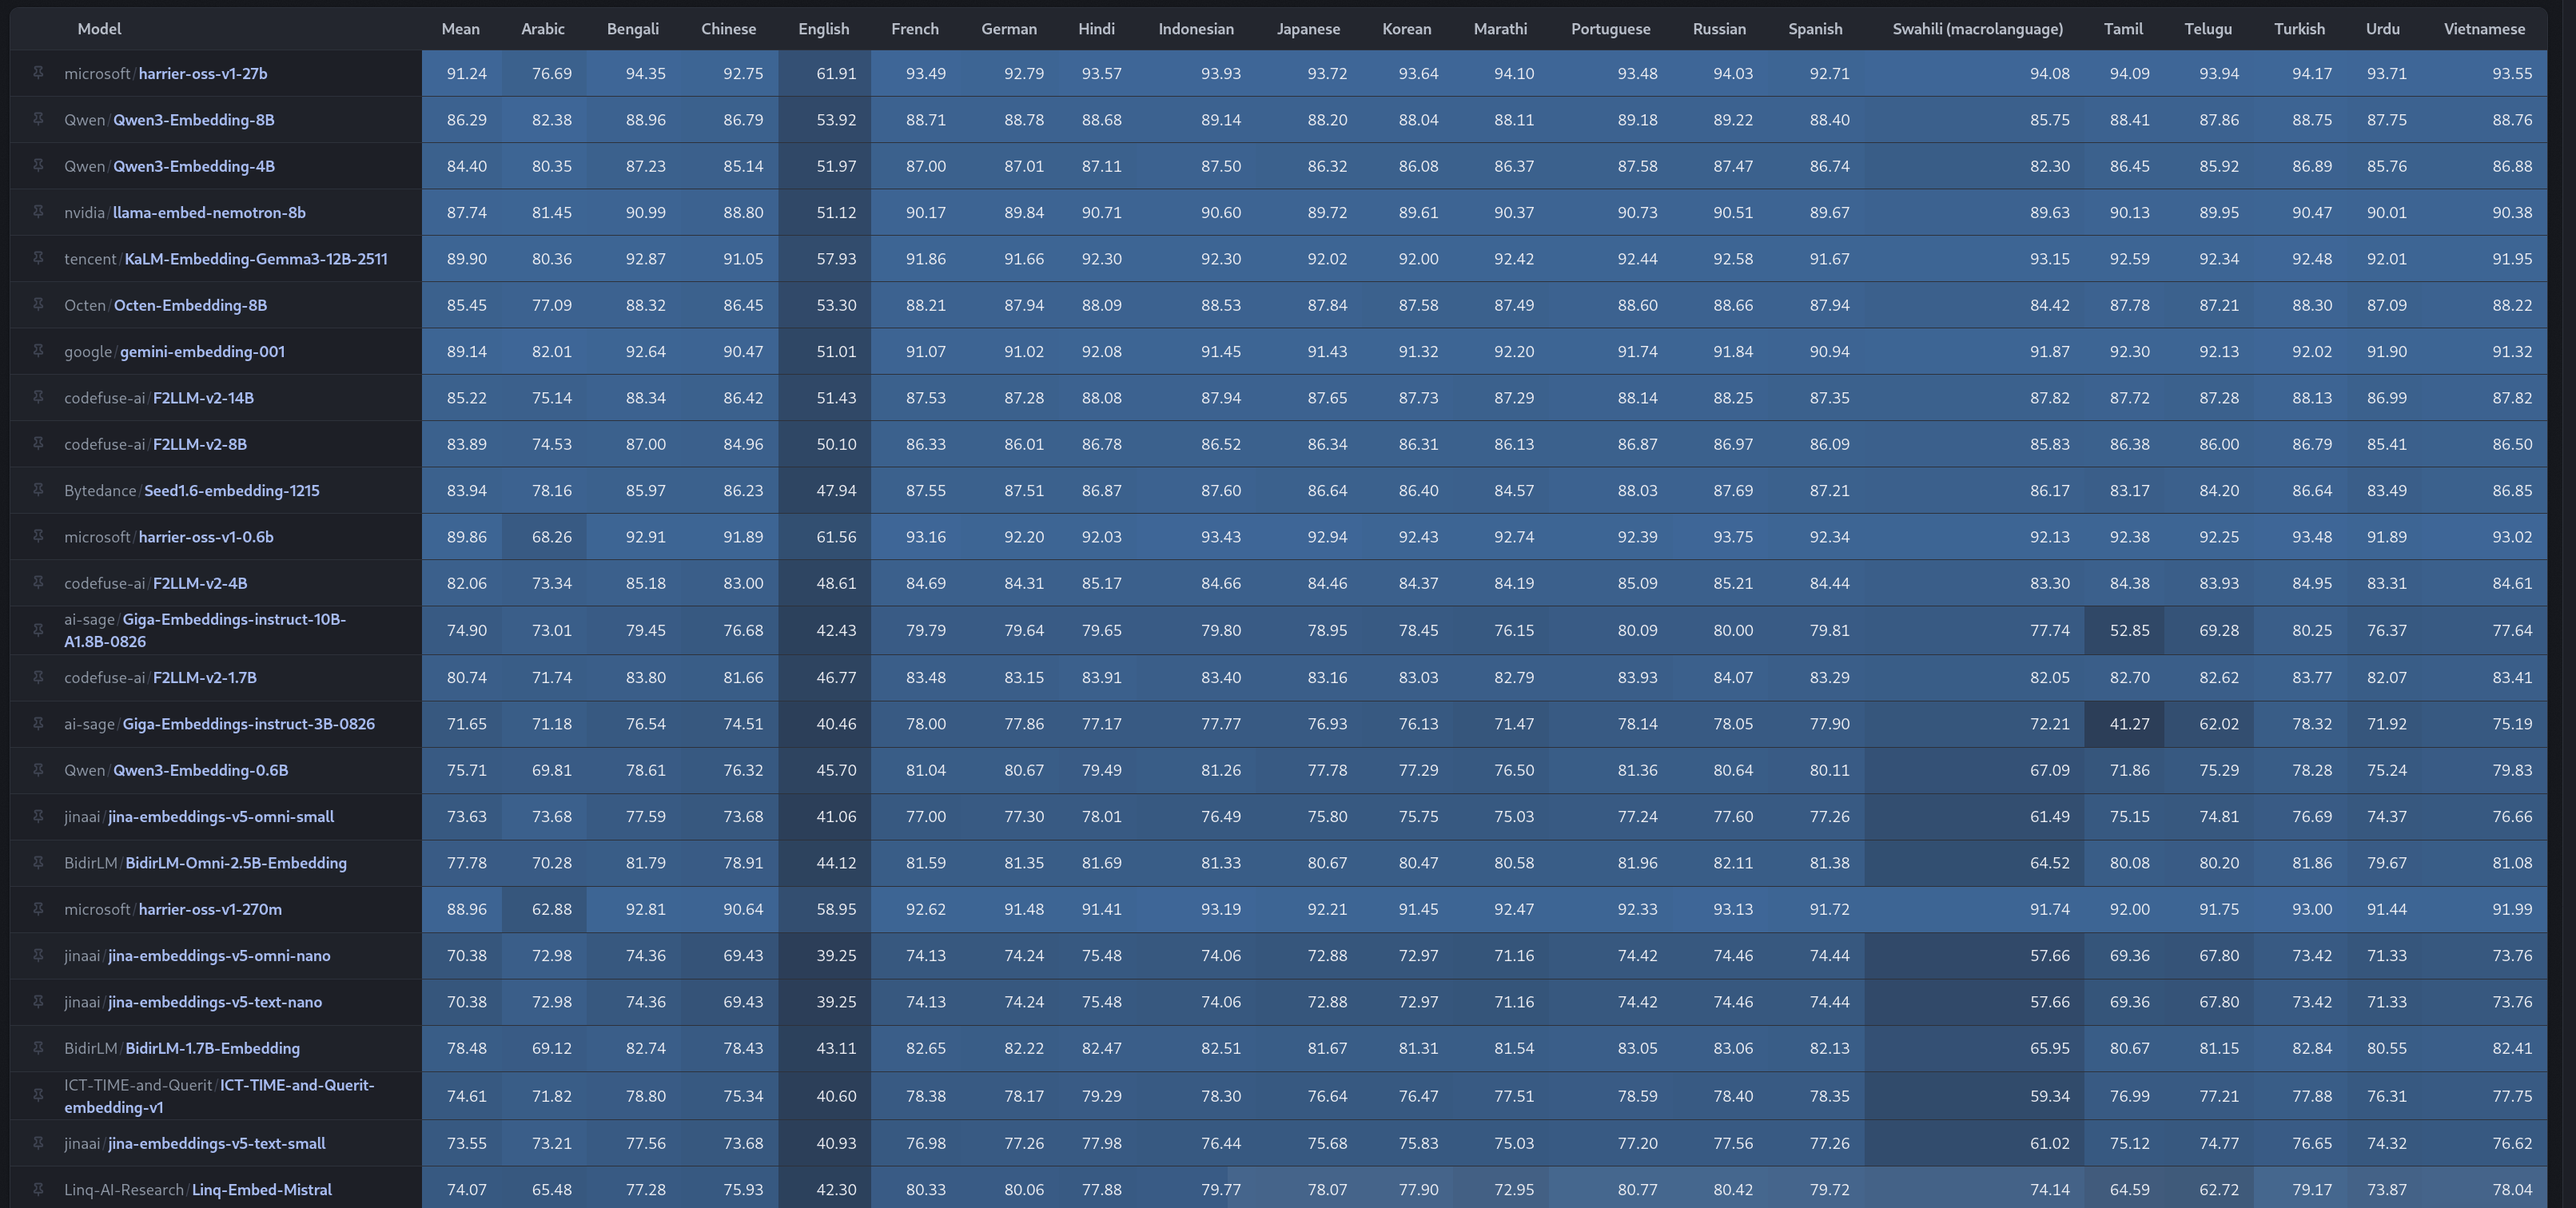
So let us look at it. Open the leaderboard, choose MTEB(Multilingual, v2),
and switch to the per-language view. Look at the model in first place,
microsoft/harrier-oss-v1-27b:
| language | score |
|---|---|
| Bengali | 94.35 |
| Tamil | 94.09 |
| Marathi | 94.10 |
| Telugu | 93.94 |
| Malayalam | 93.69 |
| English | 61.91 |
Read that again. The best multilingual embedding model in the world scores 32 points higher on Malayalam than on English.
No one believes this. The model is not better at Malayalam than at English. So the first question is not “which model is best for Malayalam”. The first question is: what is this number?
A classroom where every student gets a different question paper
Before the details, let me explain the problem using an analogy.
Imagine a school exam. Thirty students sit in one room. The teacher hands out the papers. Each student gets a different question paper. Nobody notices, because at the end only one number per student goes on the board as score.
Now look at two of those papers.
The Malayalam student gets 486 questions. 406 of them are the same question, repeated: “Here is a sentence. Find its translation.” Only the other language changes. The student scores 87%.
The English student gets 2,965 questions. 1,656 of them are also one question repeated, but a much harder one: “Here is a Bible verse. Find the matching verse in a language that has almost no written material.” The student scores 54%.
The school publishes the result:
| student | score |
|---|---|
| Malayalam | 87 |
| English | 54 |
The teacher says Malayalam is the better student.
He is wrong, and the mistake is easy to spot. The two students never answered the same questions. One number per student hides that completely. To compare them you would have to give them the same paper — or at least say, next to each score, what was on each paper.
This is exactly what the per-language column does. Every language writes a different exam, the exams differ in length and in difficulty, and the results are printed side by side in one table as if they could be compared.
The rest of this post is the detail: what is on each paper, why the papers came out this way, and what to do instead.
How the MTEB score is built
The leaderboard does not average over tasks, but averages over rows.
A row is one task, one split, one subset. For a translation-matching task, a subset is usually a language pair. So a task that pairs English with 800 other languages gives English 800 rows. A task that gives one row counts 800 times less.
There is no weighting. There is no correction for difficulty. There is no rule that two languages must share even one task.
You can read the code yourself. In
mteb, the function
_create_per_language_table_from_benchmark_results does three things: explode
the language list, group by model and language, take the mean.
What the rows look like
Here are ten real rows from Qwen/Qwen3-Embedding-8B. Every one of them counts
towards the English score, and every one counts the same amount:
| task | split | subset | score |
|---|---|---|---|
| BibleNLPBitextMining | train | aai_Latn-eng_Latn | 0.2323 |
| BibleNLPBitextMining | train | aak_Arab-eng_Latn | 0.0866 |
| BibleNLPBitextMining | train | aau_Latn-eng_Latn | 0.1927 |
| BibleNLPBitextMining | train | aaz_Latn-eng_Latn | 0.1180 |
| BibleNLPBitextMining | train | abt_Latn-eng_Latn | 0.1720 |
| … 1,651 more BibleNLP rows … | train | … | … |
| ArguAna | test | default | 0.7685 |
| AILAStatutes | test | default | 0.8509 |
| BelebeleRetrieval | test | acm_Arab-eng_Latn | 0.9891 |
| BigPatentClustering.v2 | test | default | 0.3892 |
| AmazonCounterfactualClassification | test | en | 0.9394 |
Look at the subset column. For a translation-matching task the subset is a
language pair, and each pair is counted in both directions. BibleNLP has
English plus 828 other languages, so English collects 828 × 2 = 1,656 rows
from this one task.
ArguAna is a full retrieval benchmark with 1,406 queries and 8,674 documents.
It contributes one row. The pair aak_Arab-eng_Latn also contributes one
row. The mean treats them as equal.
This sounds like a detail. It decides everything. Let us follow one number down.
Take Qwen/Qwen3-Embedding-8B, rank 2 in MTEB as of now. Its English score is 53.92. Where
does that come from?
| task | rows | mean score |
|---|---|---|
| BibleNLPBitextMining | 1,656 | 27.21 |
| FloresBitextMining | 406 | 88.48 |
| BelebeleRetrieval | 244 | 89.74 |
| NTREXBitextMining | 240 | 91.80 |
| IndicGenBenchFloresBitextMining | 116 | 94.33 |
| Tatoeba | 112 | 79.65 |
| the other 61 tasks | 191 | – |
| total | 2,965 | 53.92 |
56% of the English score comes from a single task:
BibleNLPBitextMining.
BibleNLP is a Bible translation corpus in 829 languages, aligned verse by verse. The corpus is English-aligned, so English is the pivot. Every English–X pair becomes a row for English. Most of those X languages are very low resource, so the pairs are hard, and the mean is 27.21.
Every other language gets two rows from this task — its own pair with English, in both directions. For Malayalam these are the only two:
| task | split | subset | score |
|---|---|---|---|
| BibleNLPBitextMining | train | eng_Latn-mal_Mlym | 0.9701 |
| BibleNLPBitextMining | train | mal_Mlym-eng_Latn | 0.9674 |
Two rows, both near 0.97. English gets 1,656 rows averaging 0.27, because it is paired with every low-resource language in the corpus. Same task, same model. The difference is only which side of the pair you are on.
Now remove that one task. English goes from 53.92 to 87.71.
Next, do the same for Malayalam, which scores 87.40:
| task | rows | mean score |
|---|---|---|
| FloresBitextMining | 406 | 87.17 |
| IN22GenBitextMining | 44 | 89.99 |
| NTREXBitextMining | 20 | 82.81 |
| the other 8 tasks | 16 | – |
| total | 486 | 87.40 |
84% of the Malayalam score comes from a single task:
FloresBitextMining,
which is translation matching.
This is not special to Malayalam:
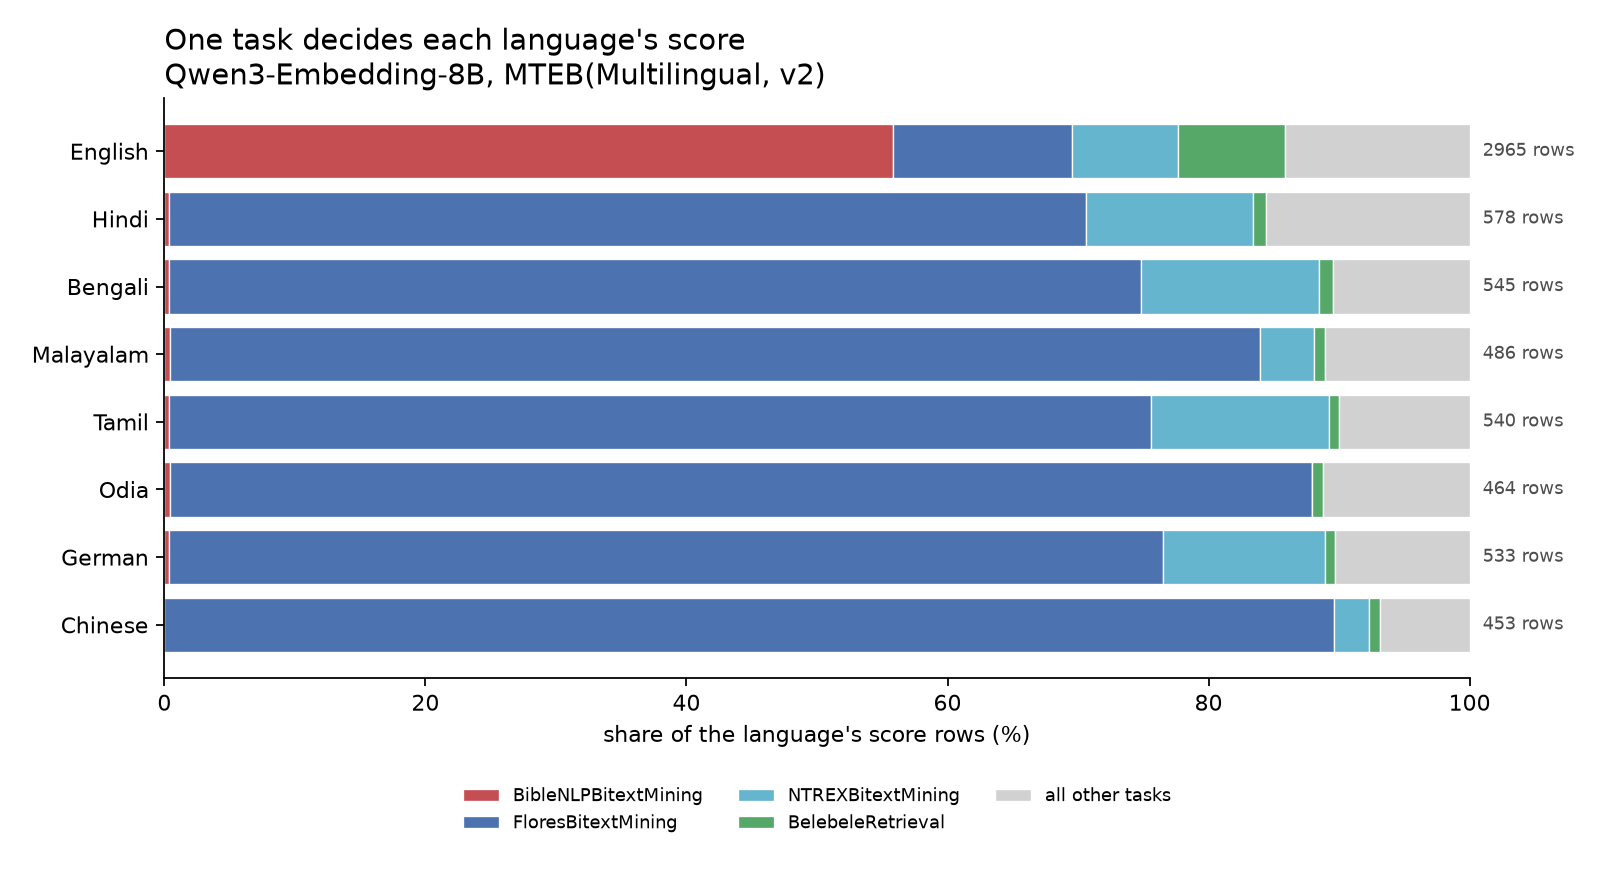
| language | biggest task | share of rows | score on it |
|---|---|---|---|
| English | BibleNLPBitextMining | 56% | 27.21 |
| Hindi | FloresBitextMining | 70% | 87.55 |
| German | FloresBitextMining | 76% | 88.13 |
| Tamil | FloresBitextMining | 75% | 87.06 |
| Malayalam | FloresBitextMining | 84% | 87.17 |
| Odia | FloresBitextMining | 88% | 87.08 |
| Chinese | FloresBitextMining | 90% | 86.55 |
The per-language table puts different languages side by side, but it does not give us a controlled comparison of their embedding quality. For most of these languages, the score is dominated by translation matching on FLORES. English is dominated by a different mixture, including a large number of low-scoring BibleNLP language pairs.
The numbers are mathematically valid summaries of the results that went into them. They are not comparable measurements of general embedding quality across languages.
That is why the whole column sits between 85 and 94. The numbers are close because they are the same measurement. English is the outlier because it is the pivot language of the hardest corpus in the set.
This is not one odd model. It is the whole top of the table:
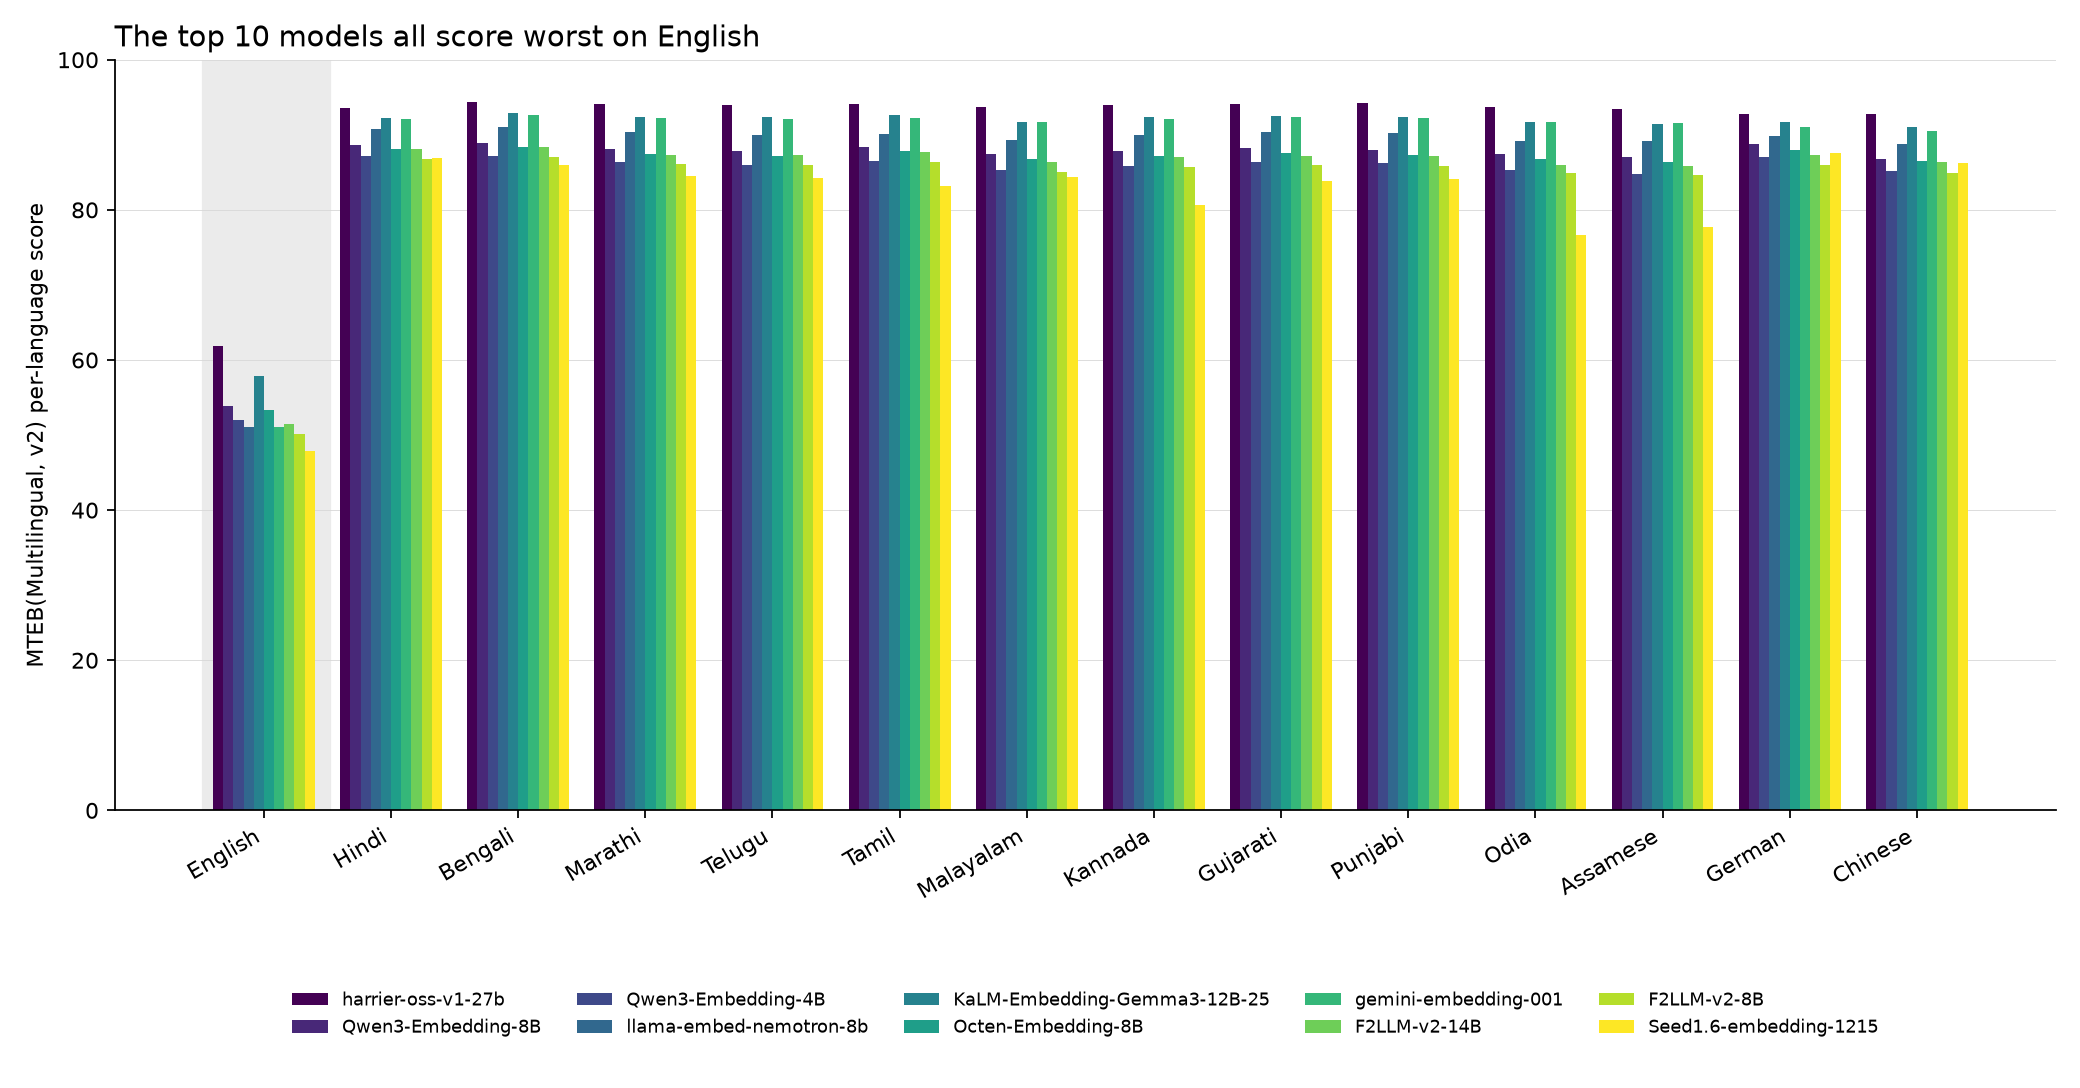
Every one of the top 10 models has the same shape. English sits far below every Indic language, and the Indic languages are almost indistinguishable from each other — because, as we just saw, they are all mostly reporting the same FLORES number.
As published, English is the lowest of the 20 languages for 25 of the top
25 models. Remove BibleNLPBitextMining and English is lowest for 0 of
25.

| model | English, as published | English, without BibleNLP | Malayalam |
|---|---|---|---|
| harrier-oss-v1-27b | 61.91 | 91.55 | 93.69 |
| Qwen3-Embedding-8B | 53.92 | 87.71 | 87.40 |
| llama-embed-nemotron-8b | 51.12 | 88.61 | 89.37 |
| gemini-embedding-001 | 51.01 | 89.34 | 91.74 |
| multilingual-e5-large-instruct | 50.85 | 87.30 | 92.05 |
Mathematically, this is correct. This is what an unweighted mean does when the things you average are very unequal in number. The English student did not do badly. The English student was handed a much harder paper, and a long one, and nobody wrote that on the board. It is a measurement artefact, and it is sitting in the first column that thousands of engineers look at when they choose a model.
One more detail worth knowing: those 1,656 BibleNLP rows are from the
train split. The leaderboard averages them into the score. That brings us
to a second problem, later in this post.
Even with the weighting fixed, the task sets are not comparable
The weighting is the main story. But there is a second, slower problem underneath it.
MTEB(Multilingual, v2) has 131 tasks. English appears in 67 of them.
Malayalam appears in 11. Awadhi appears in 4.
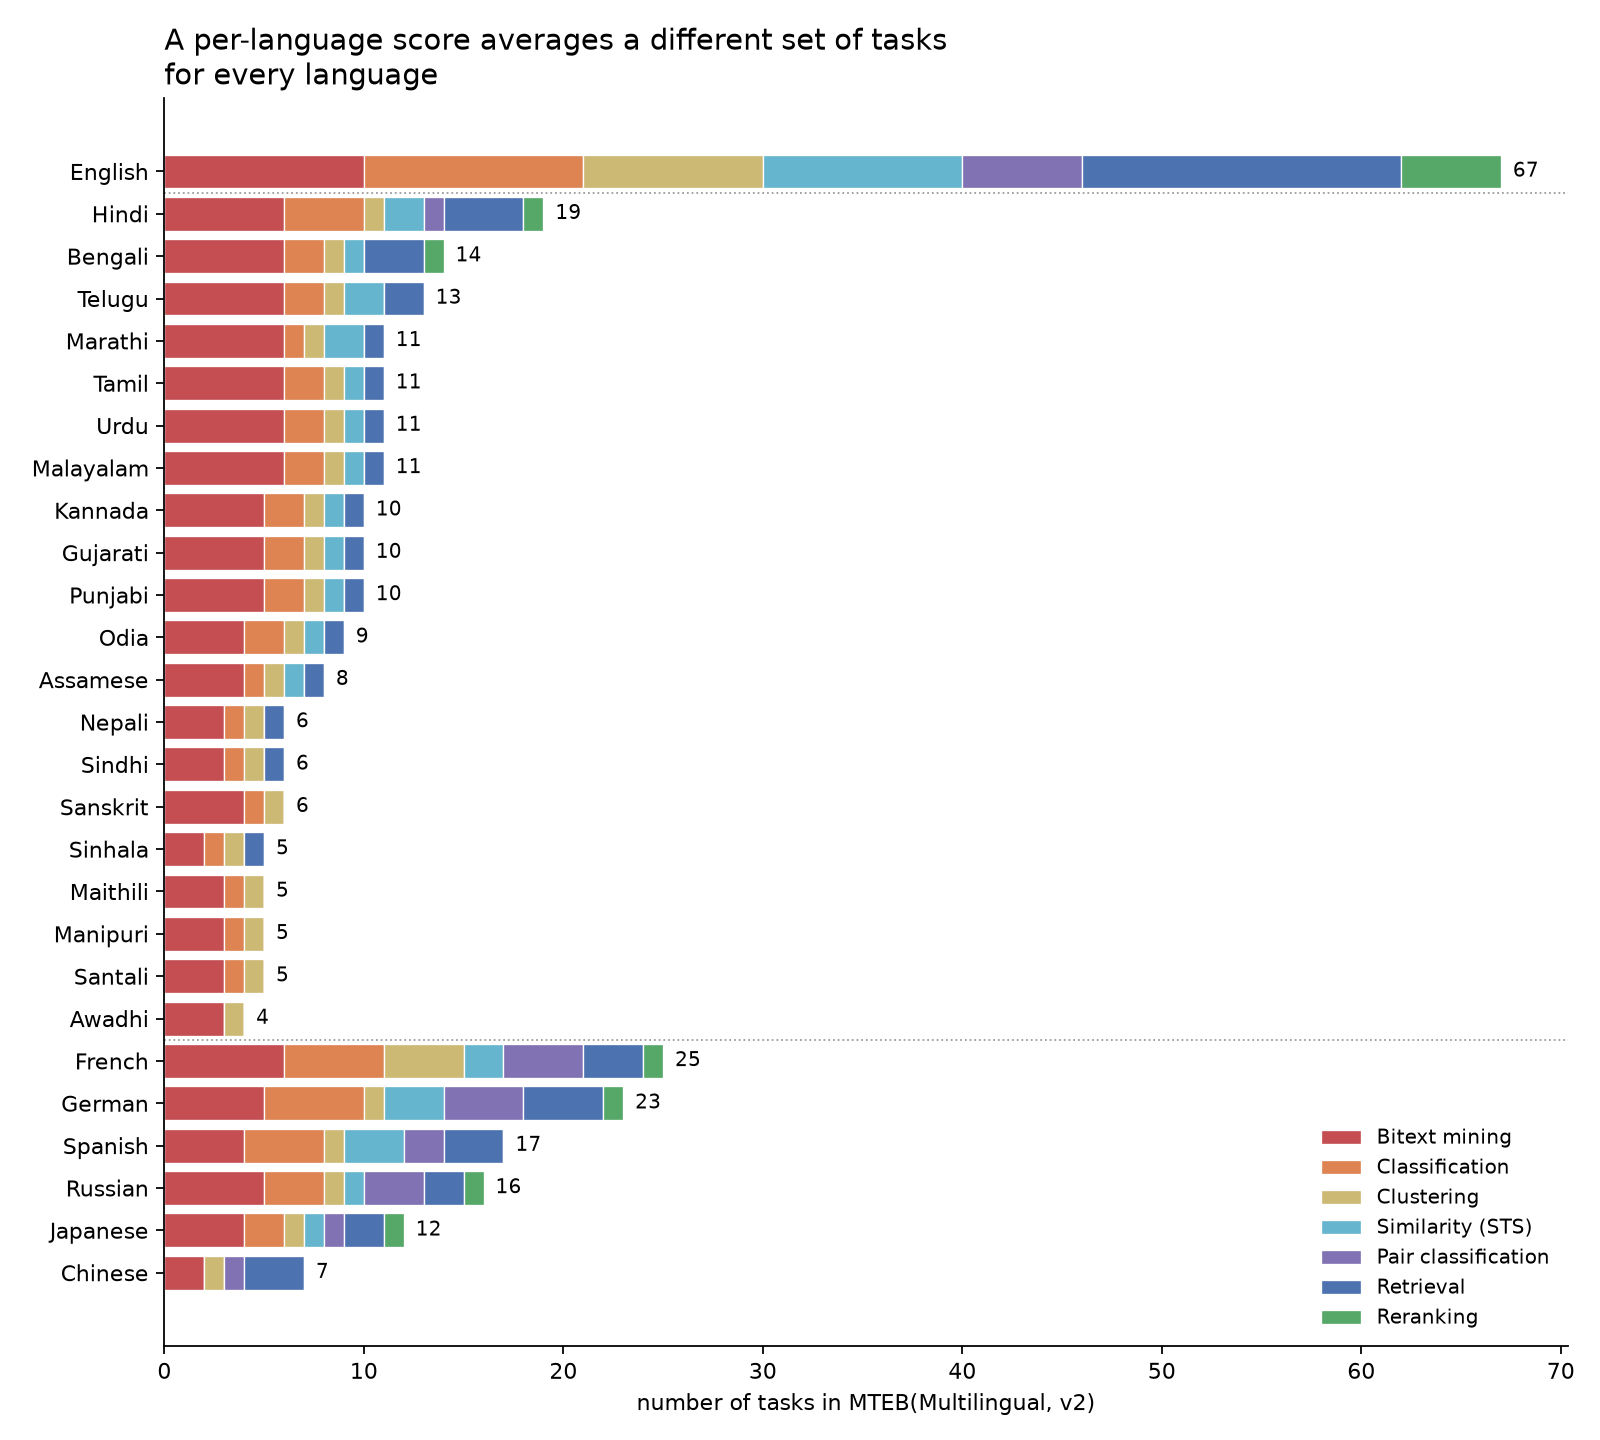
The count is not the real problem. The kind of task is.
Translation matching is cheap to build. Take any parallel corpus, and you get a task in 200 languages at once. Real retrieval is expensive. You need a document collection, queries written by speakers, and relevance labels judged by speakers. That work has been done for about 20 languages.
So as a language gets smaller, its task mix moves to the cheap end:
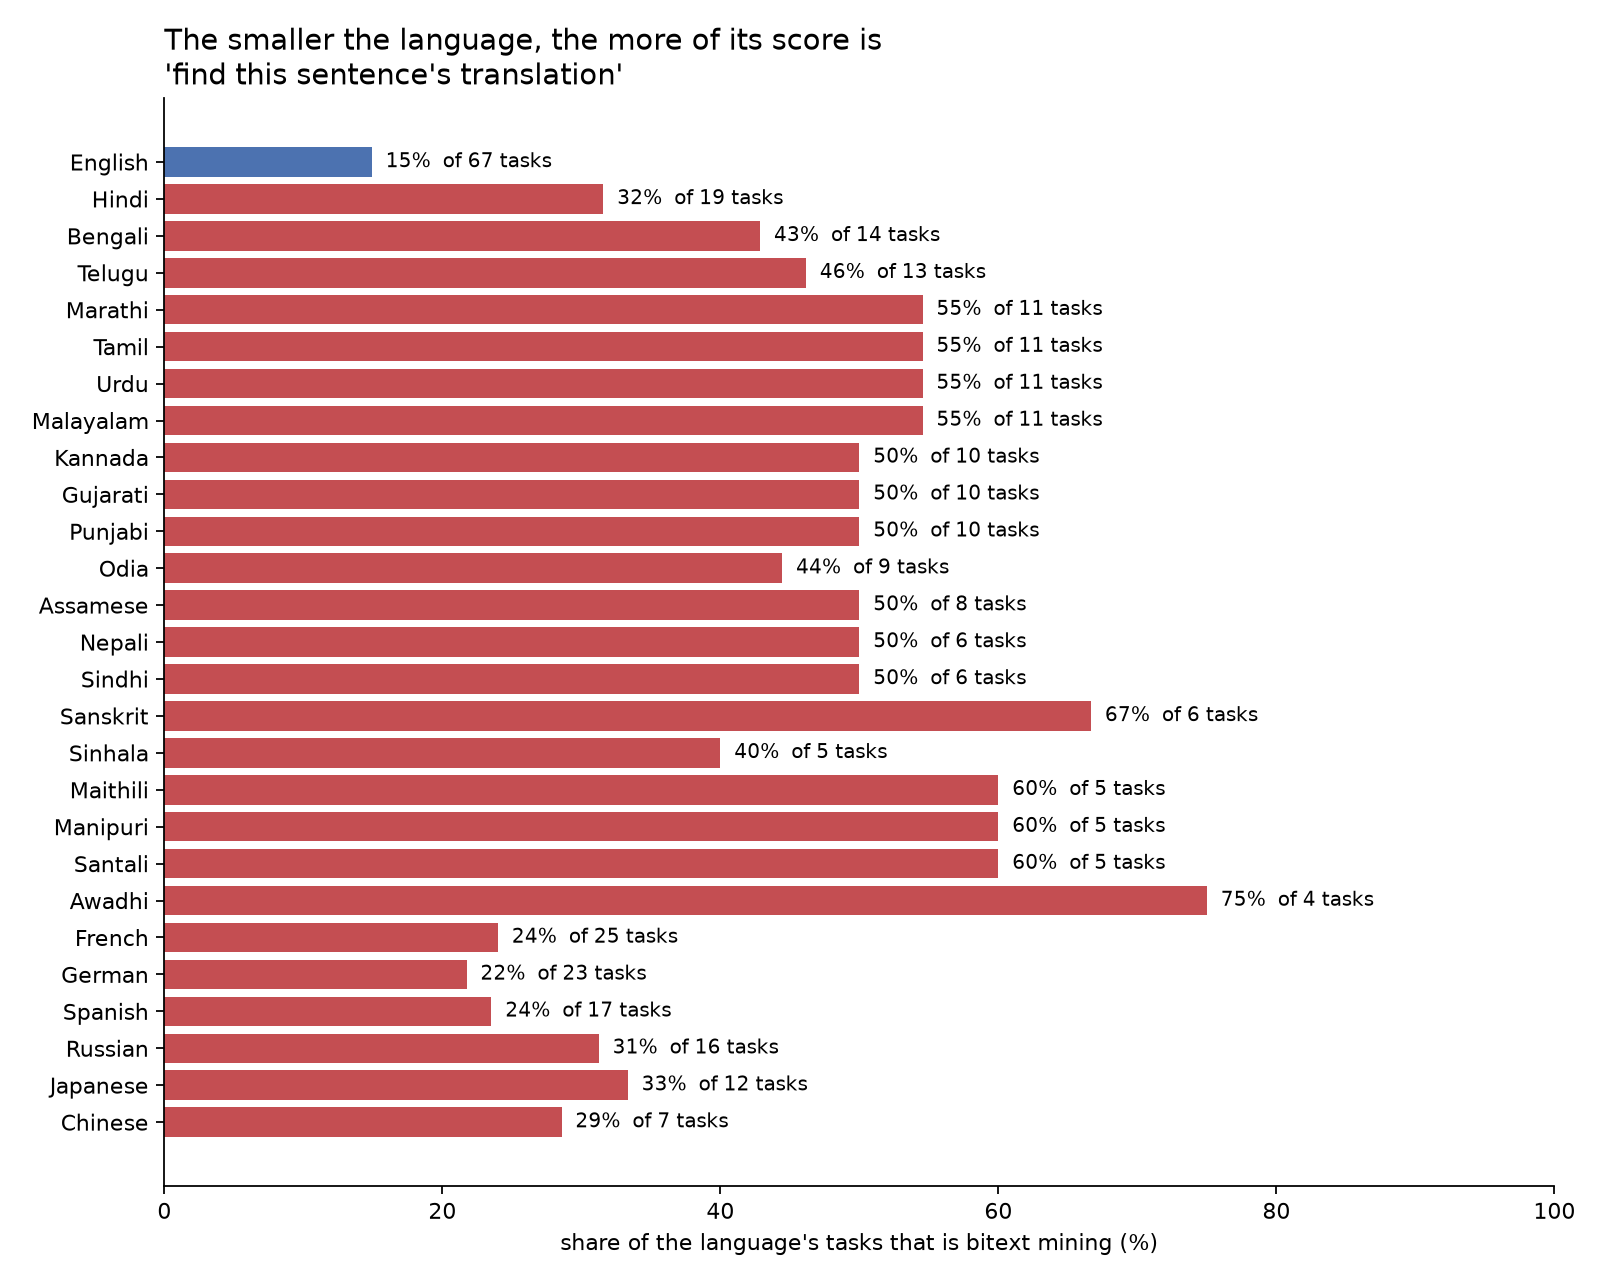
| language | tasks | bitext share |
|---|---|---|
| English | 67 | 15% |
| Hindi | 19 | 32% |
| Bengali | 14 | 43% |
| Malayalam | 11 | 55% |
| Odia | 9 | 44% |
| Awadhi | 4 | 75% |
What Malayalam is actually tested on
Here are all 11 tasks, with what each one really asks:
| task | type | the real question |
|---|---|---|
| FloresBitextMining | bitext | find this sentence’s translation |
| IndicGenBenchFloresBitextMining | bitext | the same, on a FLORES extension |
| IN22GenBitextMining | bitext | the same, on IN22 |
| NTREXBitextMining | bitext | the same, on news text |
| BibleNLPBitextMining | bitext | the same, on Bible verses |
| Tatoeba | bitext | the same, on Tatoeba |
| IndicLangClassification | classification | which language is this? |
| MassiveIntentClassification | classification | intent, machine translated |
| SIB200ClusteringS2S | clustering | 7 broad topics |
| BelebeleRetrieval | retrieval | reading comprehension |
| IndicCrosslingualSTS | similarity | English ↔ Malayalam |
Six of the eleven ask the same question. Put a sentence near its own translation. This is close to duplicate matching. Embedding models are very good at it.
IndicLangClassification is language identification. Malayalam has its own
Unicode block. A model can almost answer this from the script alone. It is a
script detector wearing the clothes of a language task.
There is no in-language semantic task at all. The one similarity set is English-to-Malayalam. The one retrieval set is Belebele, whose passages come from FLORES. Nobody has measured whether these models can rank Malayalam documents against a Malayalam query, on real Malayalam text.
And note how much of this is one corpus. FLORES, IndicGenBench-Flores, SIB-200 and Belebele are all built on FLORES-200. Malayalam’s score is close to one dataset measured four ways.
Jina Embedding Technical report
Recently, at work, I had to analyse Jina Embedding v5’s scores. Since I have those results and it prompted me to write this blog post, let me share it here.
The jina-embeddings-v5 technical report
publishes a per-language heat map in Appendix A.6. For
jina-embeddings-v5-text-nano:
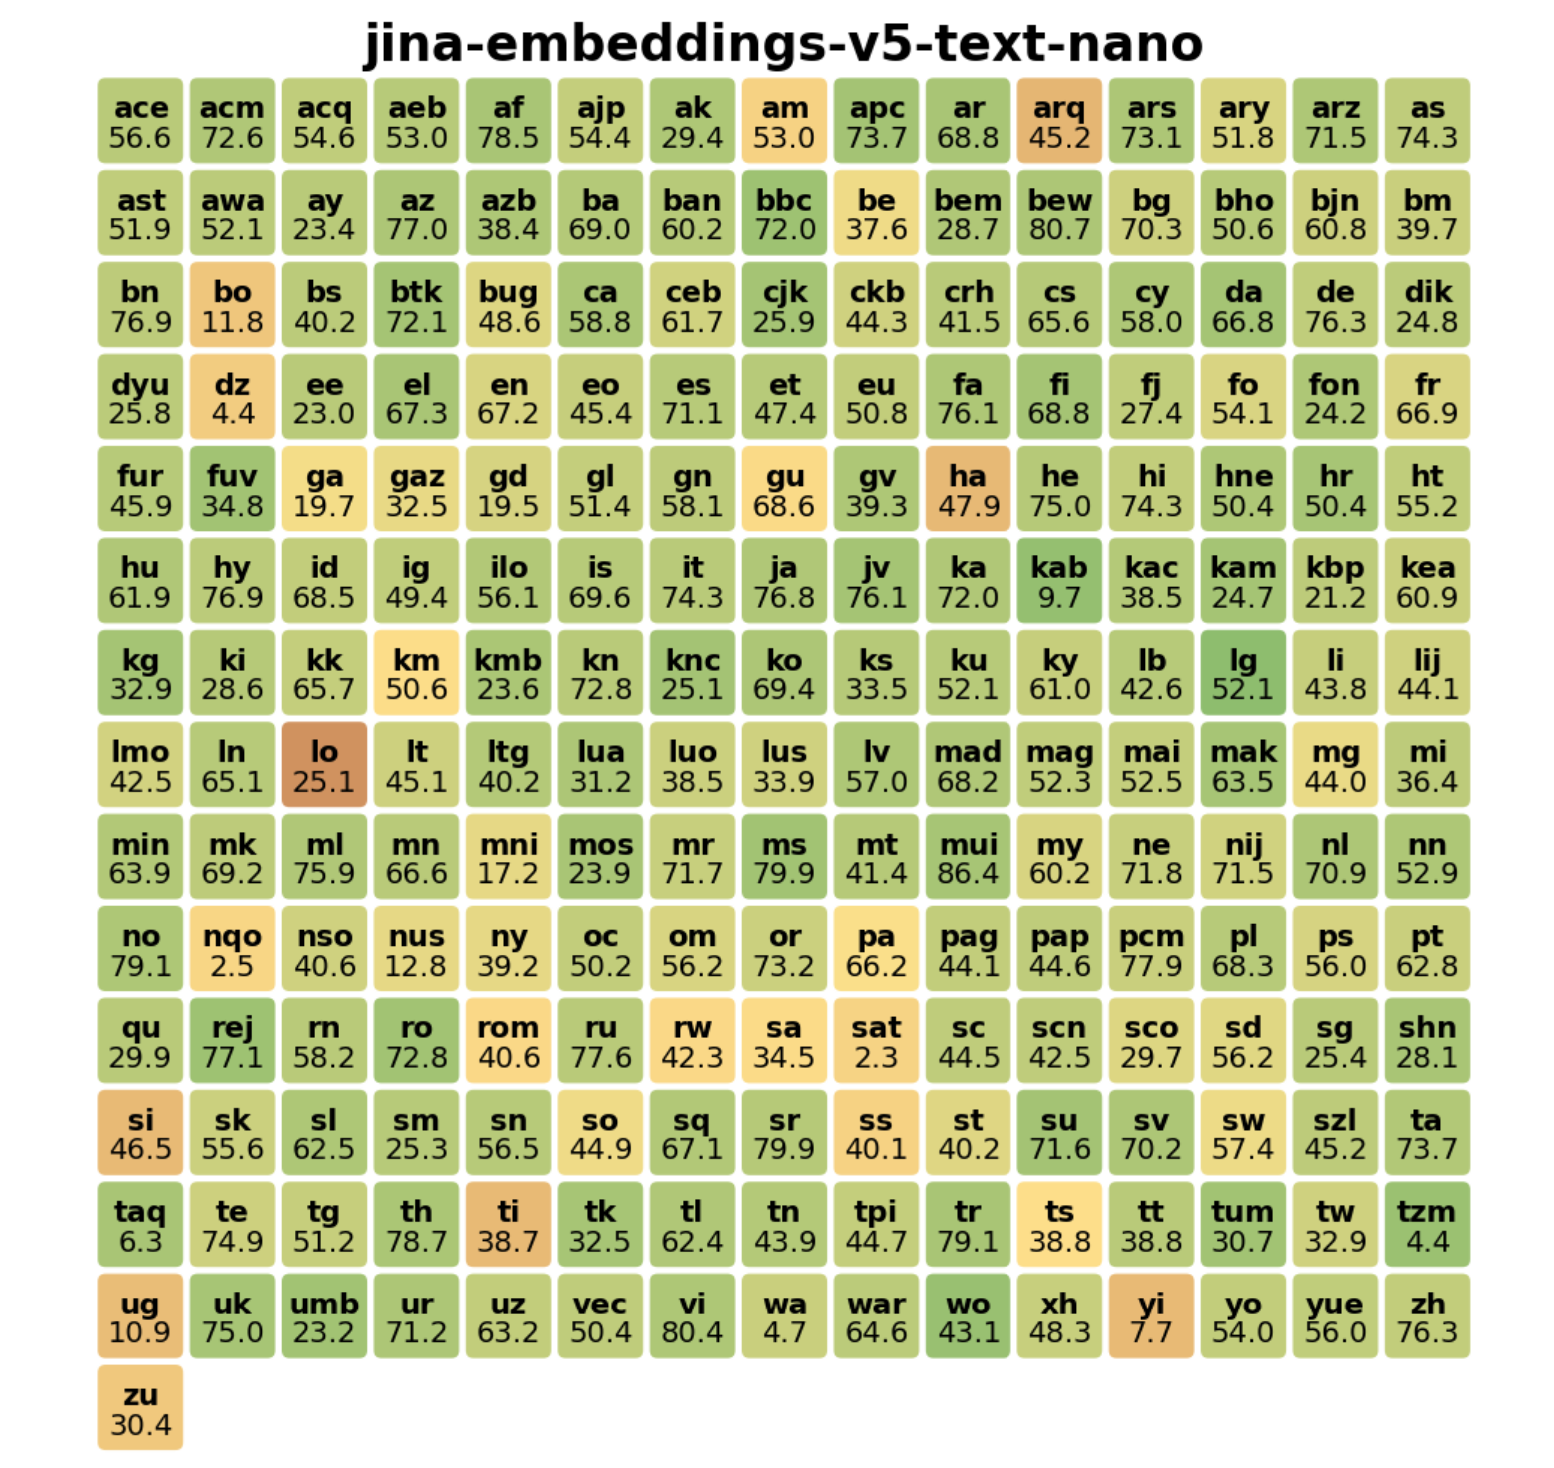
| language | score |
|---|---|
| Bengali | 76.9 |
| Armenian | 76.9 |
| Malayalam | 75.9 |
| Hebrew | 75.0 |
| Telugu | 74.9 |
| Odia | 73.2 |
| English | 67.2 |
The same shape. 11 of the 23 languages where this model has no vocabulary at all score above English.
I measured the tokenizer for that model separately. It is built on EuroBERT-210m and uses the Llama-3 vocabulary. For Malayalam and Odia it holds no word pieces, and almost no single characters. Odia text costs 12.2 times more tokens than the same content in English, and not one token decodes to a complete Odia character.
The model whose tokenizer has almost no Odia character coverage scores 6 points above English on Odia.
To be fair to Jina: they published the per-language table at all, which is why this analysis was possible. Most vendors publish one average and stop.
Benchmark is contaminated
All of the above is about how the score is computed. There is a second, separate problem: what the models saw during training.
MTEB publishes train splits. In December 2024, Nils Reimers, a co-author of the MTEB paper [1], wrote on X:
Training on the MTEB training splits and evaluating on MTEB for the leaderboard submission was never intended. […] It was a big mistake to publish these training splits for MTEB. […] The MTEB benchmark is sadly dead, and doesn’t provide a good signal anymore. It is mostly: Who overfits the hardest.
When you evaluate the models on your data & task, you see a massive shift in the ranking and how bad many of the “top MTEB models” actually perform.
We can check his claim, because MTEB records for each model and each task whether the model was trained on it.
| leaderboard position | models declaring training on ≥1 benchmark task | mean tasks declared |
|---|---|---|
| top 10 | 100% | 11.2 |
| top 25 | 76% | 8.2 |
| top 50 | 78% | 6.4 |
| 51–150 | 50% | 2.1 |
| 151+ | 34% | 1.0 |
The rank correlation between leaderboard position and number of tasks trained on is −0.376. Better rank, more overlap. “Who overfits the hardest” is visible in MTEB’s own metadata.
The model in first place declares training on 28 of the 131 tasks. The model at rank 5 declares 35. Qwen3, Gemini and multilingual-e5 declare 1. jina-v5-text-nano declares 0.
Declaring is the honest act. The risk is with the ones that did not declare.
Why this is worse for Indic languages
For Malayalam’s 11 tasks, declared overlap is almost zero. Nobody declares FLORES, Belebele, IN22 or Tatoeba.
That is weak comfort, for two reasons.
First, the declaration only covers “I trained on this MTEB task”. It does not cover “FLORES sentences were in my pretraining data”. For multilingual models that is close to universal. FLORES, Tatoeba and Bible translations are the standard parallel corpora for low-resource languages, and they are redistributed through NLLB, OPUS and Common Crawl. No checkbox catches that.
Second, contamination concentrates when coverage is thin. English spreads any one leaked corpus across 67 tasks. Malayalam’s score is 84% one corpus. A single leak moves Malayalam’s number far more than English’s.
So the languages with the least benchmark coverage are exactly the languages where contamination does the most damage, and where it is hardest to detect.
To be clear: open data is not the villain. Open FLORES and SIB-200 are why Indic languages are measurable at all. The leaderboard incentive is the villain.
What should a better benchmark look like?
If you are building an evaluation set for your language, here is what I would ask for.
Rule 1: never use an absolute similarity threshold
This is the most common mistake I see in production code:
if cosine_similarity(query, doc) > 0.85:   # wrong
    return "match"
Cosine values are not comparable across models. Each model has its own scale. One model puts everything between 0.95 and 0.99. Another spreads the same pairs between 0.6 and 0.85. The number 0.85 means a different thing in each. It also shifts between languages, and between model versions.
Let us go back to the classroom. Now the papers are the same, but two teachers mark them. The first teacher is generous and gives every answer between 95 and 99. The second is strict and gives the same answers between 60 and 85.
A mark of 90 is poor work from the first teacher and excellent work from the second. The mark alone tells you nothing. You have to know who held the pen.
This is what an absolute cosine threshold assumes away. A threshold you tuned on English will quietly break on Malayalam. A threshold you tuned on one model will quietly break when you upgrade it.
Raw cosine-similarity values are not a universal measure of semantic equivalence. Their distributions can differ across models, languages and tasks, so a threshold chosen for one setting should not be assumed to work in another.
Ranking candidates against one another avoids the need for a universal threshold and is a better starting point for evaluating retrieval. But ranking alone is not enough: the candidate set, the relevance of the results, and the application’s acceptance criteria still matter.
Evaluate the ordering first. Calibrate any threshold separately, using representative data from the application in which it will be used.
Rule 2: measure order, not distance
Build items like this instead:
- one base sentence
- one positive that means the same thing
- several negatives that are close in surface form but different in meaning
Then ask one question: does the positive score higher than every negative?
That is it. Pass or fail. No threshold. The result is stable across models, across languages, and across model versions, because only the order matters.
An example in Malayalam
Here is a real item. Malayalam joins words into compounds and doubles a consonant at the join. That doubling changes the meaning.
| role | Malayalam | meaning |
|---|---|---|
| base | ആനപ്പുറത്തു കയറി | climbed onto the elephant’s back |
| positive | ആനയുടെ പുറത്തു കയറി | climbed onto the elephant’s back |
| negative | ആന പുറത്തു കയറി | the elephant climbed outside |
| negative | ആന അപ്പുറത്തു കയറി | the elephant climbed to the other side |
| negative | ആനപ്പുറത്തുനിന്നും ചാടി | jumped down from the elephant’s back |
| negative | ആന പുറത്തു പോയി | the elephant went out |
The base and the positive say the same thing in two ways: a compound (ആനപ്പുറത്ത്) and a genitive (ആനയുടെ പുറത്ത്). The negatives are one or two characters away from the base and mean something else.
For this item, a model that captures the intended semantic distinction should rank the positive above all four negatives.
I ran four models. Only one of these four models passed this item.
| model | MTEB rank | MTEB Malayalam | rank of positive | result |
|---|---|---|---|---|
| Qwen3-Embedding-0.6B | 16 | 72.53 | 3rd of 5 | fail |
| jina-embeddings-v5-text-nano | 21 | 69.39 | 3rd of 5 | fail |
| multilingual-e5-large-instruct | 31 | 92.05 | 2nd of 5 | fail |
| LaBSE | 128 | 83.38 | 1st of 5 | pass |
The scores, which show why thresholds are useless:
Qwen3-Embedding-0.6B — ranks two negatives above the positive:
| cosine | role | sentence |
|---|---|---|
| 0.8546 | negative | ആന അപ്പുറത്തു കയറി |
| 0.8465 | negative | ആന പുറത്തു കയറി |
| 0.8015 | positive | ആനയുടെ പുറത്തു കയറി |
| 0.7393 | negative | ആനപ്പുറത്തുനിന്നും ചാടി |
| 0.7330 | negative | ആന പുറത്തു പോയി |
multilingual-e5-large-instruct — closer, but still wrong:
| cosine | role | sentence |
|---|---|---|
| 0.9886 | negative | ആന അപ്പുറത്തു കയറി |
| 0.9780 | positive | ആനയുടെ പുറത്തു കയറി |
| 0.9759 | negative | ആനപ്പുറത്തുനിന്നും ചാടി |
LaBSE — correct:
| cosine | role | sentence |
|---|---|---|
| 0.8158 | positive | ആനയുടെ പുറത്തു കയറി |
| 0.8027 | negative | ആന അപ്പുറത്തു കയറി |
| 0.7844 | negative | ആനപ്പുറത്തുനിന്നും ചാടി |
Look at the absolute numbers across those three tables.
multilingual-e5 gives 0.9886 to a wrong answer. LaBSE gives 0.8158 to the right one. If you had used a threshold of 0.9, e5 would accept all five sentences and LaBSE would reject all five. The model with the higher cosine is the model that is wrong.
This is the point. The absolute value tells you nothing. The order tells you everything.
And note the ranking. LaBSE is from 2020. It sits at rank 128. On MTEB Malayalam it scores 83.38, which is 8.7 points below multilingual-e5. On this test it is the only model that works.
This illustrates the kind of ranking shift described by Nils Reimers described in that X post.
Rule 3: write the items in the language, not in translation
Every Malayalam item above tests something that only exists in Malayalam: compound gemination, and the pair പുറത്ത് / അപ്പുറത്ത്. You cannot get these by translating an English test set. A translated benchmark tests translated phenomena.
This is work only speakers can do. It is time taking work. A hundred items of this kind, written by one careful speaker will tell you more about a model than the entire per-language column.
I am working on such an evaluation dataset, but nothing to share for now as it is progressing very slowly.
Rule 4: report what the test is made of
If you publish a benchmark, publish the task count, the task mix, and the source corpus for each language, beside the score. If one task is 84% of a language’s number, say so in the table.
A checklist
A per-language benchmark is worth trusting when:
- scores are compared only within a language, or across languages on strictly parallel data
- no metric uses an absolute similarity threshold
- items are written by speakers, not translated
- negatives are close in surface form and clearly different in meaning
- the task mix per language is published with the scores
- no single task is more than a small share of a language’s score
- train splits are not published, or are clearly excluded from scoring
Today, MTEB(Multilingual, v2) fails most of these for Indic languages. This
is not a reason to abandon it. It is a list of things to fix.
How to choose an Embedding model
If you are choosing an embedding model for an Indic language:
Do not pick a model from a leaderboard column. You now know what that column contains.
Build 100 items like the elephant example. Base, positive, close negatives. Score by order, never by threshold. One afternoon with a speaker.
Then test retrieval on your own documents. Take 50 to 100 real queries, run them against your real corpus, and count how often the right document comes back in the top 10. This is the only number that is about your product, and the only one that cannot be contaminated, because the data is yours.
If you do not speak the language, ask someone who does to look at the top 10 results for 20 queries. One hour of a speaker’s time beats any leaderboard.
Check the tokenizer cost before you commit. It sets your bill and your chunk size whatever the quality turns out to be. For a model with no Malayalam vocabulary, a 512-token chunk holds about 2,500 characters of English and about 320 characters of Malayalam. That changes your whole retrieval design.
See my article: Broken Token: Tokenization for Malayalam Language Models
Closing
The MTEB leaderboard is not lying. It answers a narrow question, carefully. The problem is that the question it answers is much smaller than the question people read it as.
For most languages, the per-language score answers: how well does this model match a FLORES sentence to its English translation? That is a real skill. It is not search, it is not similarity, and it is not support.
For the roughly 100 languages with no in-language retrieval set, nobody knows the answer to the real question. Not the leaderboard, not the vendors, not me. That gap is not a flaw in anyone’s methodology. Closing this gap requires new evaluation data for the languages and tasks that existing benchmarks underrepresent, developed with speakers and domain experts, and evaluated in ways that limit leakage.
Until then, remember the classroom. The students sat different exams. Before you read anything into a score, ask to see the question paper.
References
[1] Niklas Muennighoff, Nouamane Tazi, Loic Magne, and Nils Reimers. 2023. MTEB: Massive Text Embedding Benchmark. In Proceedings of the 17th Conference of the European Chapter of the Association for Computational Linguistics, pages 2014–2037, Dubrovnik, Croatia. Association for Computational Linguistics.
[2] Nils Reimers. Post on X, 22 December 2024.
[3] Jina AI. 2026. jina-embeddings-v5-text technical report. arXiv:2602.15547. Per-language results in Appendix A.6.
[4] NLLB Team. 2022. No Language Left Behind. Source of the FLORES-200 evaluation set.
[5] Lucas Bandarkar et al. 2023. The Belebele Benchmark.
[6] David Adelani et al. 2023. SIB-200.
Reproducing this
All numbers in this post come from MTEB’s own published results and its own aggregation function. Nothing is re-implemented.
Files: fetch_mteb.py, plot_mteb.py, triplet.py
pip install mteb matplotlib polars sentence-transformers

# Rebuild the per-language table, including languages the leaderboard
# does not display. Uses mteb's own aggregation function.
python fetch_mteb.py        # -> MTEB_Multilingual_v2_per_language_extended.csv
                            #    results/mteb_long.parquet

# Every figure in this post
python plot_mteb.py         # -> figures/*.png

# The ranking test on the Malayalam item
python triplet.py
The rebuilt table reproduces the published leaderboard exactly for all top 10 models.